
Showing posts with label Statistical literacy. Show all posts
Showing posts with label Statistical literacy. Show all posts
Tuesday, 14 July 2015
Conducting statistical tests for fieldwork
The Geographical Association has released a splendid new resource for those using statistical methods in their fieldwork.
 The resource has a range of videos which explain how to use particular statistical techniques.

Wednesday, 29 October 2014
A slightly random post...
 What is randomness ?
We use random numbers in geography when carrying out geography fieldwork - this is used to identify points within a field area and aid sampling techniques.
I used to do fieldwork on salt marshes with sixth form groups and we would use random number tables to choose our locations. But how random were those numbers ? And did we use them correctly ?
Randomness is an interesting statistical concept.
Does pressing the random number key on a calculator really generate a truly 'random' number ?
There was a useful article on the nature of randomness.
Wind Turbines and bird deaths are a story which has been used to indicate the downsides of this form of alternative energy. Do birds really fly into the turbines and get killed in any sort of numbers ?
How random would this act be ? Or are there particular places that are more at risk of bird strike ?
How about this for another way to explore randomness...
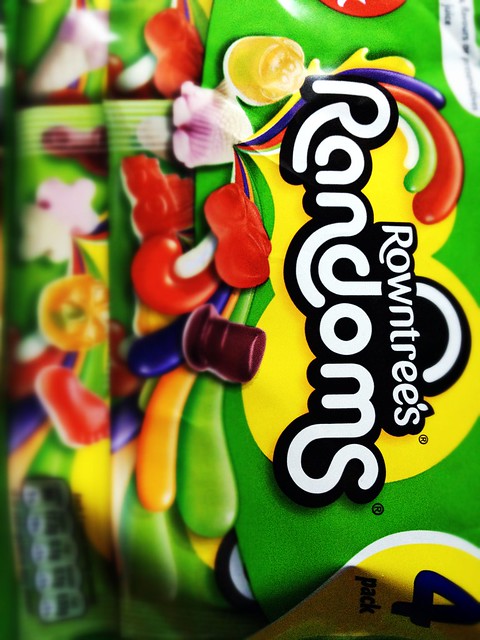
I bought some pack of Random sweets. These are made by Nestle. They contain apparently a random set of strange jelly items. How random are they ? Would be interesting to find out how many of the packs are similar...
Similar sweets may be available in your own country of origin.
For a slightly better explanation of all things random, you should take a read of this recent post by Jess Whittlestone on the fact that we tend to see patterns in everything.
Image: Alan Parkinson
Thursday, 29 May 2014
New report from the Royal Statistical Society

A main purpose for the I-USE project is the development of statistical literacy in teachers and students.
This new report from the Royal Statistical Society looks for the opportunities for exploring statistical literacy that are offered across the main 'A' level subjects in the UK - similar opportunities will no doubt be offered by comparable subjects / assessments in other EU countries, and also by the IB.
The report explores the possibilities for the following subjects:
Biology
Business Studies
Chemistry
Computing
Economics
Geography
History
Physics
Psychology
Sociology
The report can be downloaded in PDF format by clicking THIS LINK.
Monday, 20 January 2014
Statistical literacy - some Geography contexts...
It's important to make clear that unlike most of the projects that I'm currently involved in, and am likely to be involved in, this is not a geography project.
Statistical literacy is a skill that is required by all students, and would be best taught in all subjects, so that students became aware of the literacy elements that were relevant.
The previous post which refers to the work of Hans Rosling is a reminder that numbers are of vital importance if we want to fully understand the world, and the way that it works.
Which areas of geography are you particularly focussing on at the moment.
Where does statistical literacy come into the work that you are doing ?
Statistical literacy is a skill that is required by all students, and would be best taught in all subjects, so that students became aware of the literacy elements that were relevant.
The previous post which refers to the work of Hans Rosling is a reminder that numbers are of vital importance if we want to fully understand the world, and the way that it works.
Which areas of geography are you particularly focussing on at the moment.
Where does statistical literacy come into the work that you are doing ?
Saturday, 12 January 2013
Statistics Resources Online
While carrying out the research to uncover some of the available resources and ideas for statistics teaching in the UK, I came across some other materials
USA

A useful set of materials has been produced and shared at STEW: Statistics Education Web
This has a range of activities for different grades within the US system.
If anyone reading this is aware of any specific support for statistics education within the UK in particular, please get in touch. I am already pursuing several avenues, but you may be able to save me some time, and for that I would be grateful.
USA
A useful set of materials has been produced and shared at STEW: Statistics Education Web
This has a range of activities for different grades within the US system.
If anyone reading this is aware of any specific support for statistics education within the UK in particular, please get in touch. I am already pursuing several avenues, but you may be able to save me some time, and for that I would be grateful.
Monday, 17 December 2012
Launch meeting... Day 1
“Statistical thinking will one day be as necessary for efficient citizenship as the ability to read and write.”
H.G. Wells
That day is today....
The I-USE project was officially launched on the 13th of December 2012 at a meeting hosted by the University of Ghent's Department of Geography. The University is the lead partner on this project.
The project is aimed at developing a course, and supporting materials for teachers and students for the development of statistical literacy.
The meeting was chaired by Luc Zwartjes.
Partners introduced themselves: a range of experiences and subject areas - there were quite a few geographers which is always a bonus. There are partners in the project from several EU countries - the UK is represented by the Geographical Association.
Other partners include the European Association of Geography Teachers (EUROGEO), two Danish data companies (PHEIT and DUUS Data & Media), and the University of the Aegean.
There was also one sub-contractor, who will create the website which will allow users to interrogate data in innovative ways: GIS Analytics Ltd.
There were also representatives from two schools where the materials will be piloted - in the Czech Republic & Denmark.
The first morning started with a welcome from Professor Nico Vande Weghe, followed by short introductions from the project partners. There is a range of experiences and subjects which are represented. Some of the partners are experienced in previous EU projects, with connections to iGUESS and Digitalearth
The next step up to and after lunchtime, was to review the work that would be carried out in the project by the partners.
There are a number of key things which we will be producing, including some courses and materials for teachers as well as a web-based toolkit. There will be further materials to come during the three year lifetime of the project.
There are connections here with other EU projects such as iGUESS and digitalearth.eu
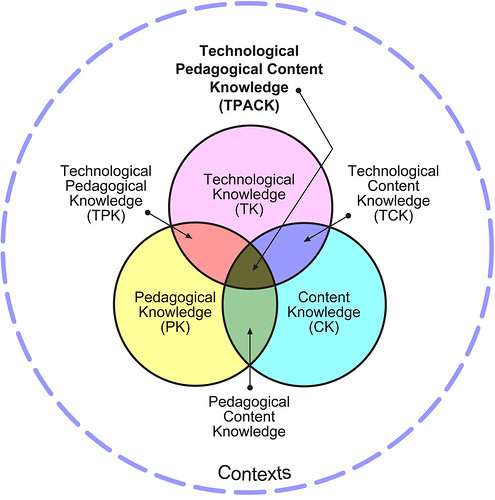
We will also be making reference to the TPCK or TPACK model when the materials are produced. This is a model which explores the importance of different types of knowledge and connects with the GA's model of 'curriculum making' or 'living geography'. The model can be seen below - more on this as the blog develops...
Thursday, 13 December 2012
Welcome to I-USE
 Welcome to this new (as I write this) blog.
The project officially started on the 1st of October 2012

It will describe the work that is done during the duration of the I-USE project, which has been funded for three years from 2012. The project has some ambitious targets and outcomes, which we will share with you over the next three years as we work towards achieving them.
The context is a simple, but important one.
It's about making sense of a world of data... and helping students to explore this world of data...

Statistical literacy is becoming increasingly important. This includes an element of information literacy, but also digital literacy.
 Students (and teachers) are now living in a society that demands evidence-based arguments and decisions. While the world is changing rapidly with respect to the prevalence and use of statistics, the curriculum in schools and the approaches teachers adopt tend to be slow to respond to such changes. Therefore creating meaningful, innovative teacher training plays a crucial role in developing statistical thought processes. Using statistics provides simple yet instant information on the matter it centres on.
 Teachers do not always consider new forms of visualising statistical information as part of curriculum courses as they are not explicitly mentioned. As a result, in some secondary schools, many students don’t have an opportunity to learn to work with statistics and computer-based visualisations.
Therefore, despite the fact that statistics offers powerful tools for information analysis and interpretation, many students are unable to extract meaning from the data and information they are presented with.
The dilemma is that as more data becomes readily available and the tools for visualising and analysing the data become more sophisticated, the ability to produce useful information from the analyses is outpacing the capacity to use the knowledge productively.
 Modern computer-based visualisations create a vivid presentation of collected and organized data through the use of figures, charts, living and interactive diagrams and graphs, which helps lead to more critical analyses of information.
The I-USE project will result in the development of teacher training courses and materials which will enable the teaching of statistics in a range of subjects.
As a geographer, I'm looking forward to working with project partners from UK, Belgium, Sweden, Denmark, Czech Republic, Bulgaria and Greece.
Subscribe to:
Posts (Atom)